| Affinity K = | [Ab - Ag] [Ab] x [Ag] |
= 104 to 1012 L/mol |
Interactions between antigen and antibody involve non-covalent binding of an antigenic determinant (epitope) to the variable region (complementarity determining region, CDR) of both the heavy and light immunoglobulin chains. These interactions are analogous to those observed in enzyme-substrate interactions and they can be defined similarly. To describe the strength of the antigen-antibody interaction, one can define the affinity constant (K) as shown:
| Affinity K = | [Ab - Ag] [Ab] x [Ag] |
= 104 to 1012 L/mol |
| Affinity K = | 1 1 x 1 |
= 100 L/mol |
Experimentally, if one adds a known concentration of antibody to a tube and then adds increasing amounts of the specific antigen, the Ag-Ab complexes will begin to precipitate. If one continues to add increasing amounts of antigen, the complexes will begin to dissolve and return to solution. The following graph illustrates this process.
| Tube # | 1 | 2 | 3 | 4 | 5 | 6 | 7 | ||
| Amount of precipitate | |||||||||
| Amount of Ag (arbitrary units) |
1 | 2 | 3 | 4 | 5 | 6 | 7 | ||
| If one then measures the amount of antigen and antibody remaining in the supernatant, one sees the following: | |||||||||
| Excess Ab | + | + | + | - | - | - | - | ||
| Excess Ag | - | - | - | - | + | + | + | ||
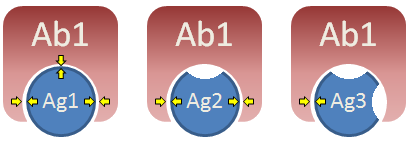 Crossreactivity can occur when two (or more) antigens share similar structural features. Consider three different antigens, as shown on the right. Antibody produced in response to Ag1 is very specific and would, therefore, have a large affinity constant (K) when combining with Ag1. However, Ag2 is similar in shape to Ag1 and is capable of interacting with anti-Ag1 antibody via two of three sites. The interaction between Ab and Ag2 is not as strong as the interaction between Ab and Ag 1 (i.e. K is much smaller) but is still strong enough to allow binding. Hence, Ag1 and Ag2 are said to cross-react. Ag3, in contrast, cannot interact very well with anti-Ag1 antibody and would have a K value so low that significant binding would not occur. Ag3, therefore, would not cross-react with Ag1. Would antibody produced in response to Ag2 bind Ag3? Would antibody produced in response to Ag2 bind Ag1?
Crossreactivity also forms the basis for several diagnostic tests. For example, infection with Treponema pallidum (syphilis) causes the production of antibodies that cross-react with a substance found in cardiac muscle, cardiolipin. Since it is much easier to obtain pure cardiolipin than pure Treponemal antigens, this cross-reaction is used to test for syphilis (Wassermann test). Likewise, antibodies produced against certain Rickettsia cross-react with antigens from Proteus. Since the latter are much easier to obtain, they can be used to test for the former.