Teepees (TPs) are a useful test of a spectrograph because they have a lot of structure in them on a wide range of intensities and time scales within a single event. An instrument that can resolve this structure may help elucidate their nature. This note is intended as a demonstration of the sensitivity and dynamic range of digital receivers, particularly SDRPlays, in spectrographs. I've picked out a few recent events and will provide plots with varying instrument parameters.
The first TP is shown in the following spectrograph in raw form. The gain is set so that statistical fluctuations of the background intensity, given the channel bandwidth and integration time, provide a few ADC counts of fluctuation of the spectrogram intensity. This way the receiver noise is resolved without excessive reduction of the dynamic range. But in the process a relatively faint structure such as this has insufficient contrast.
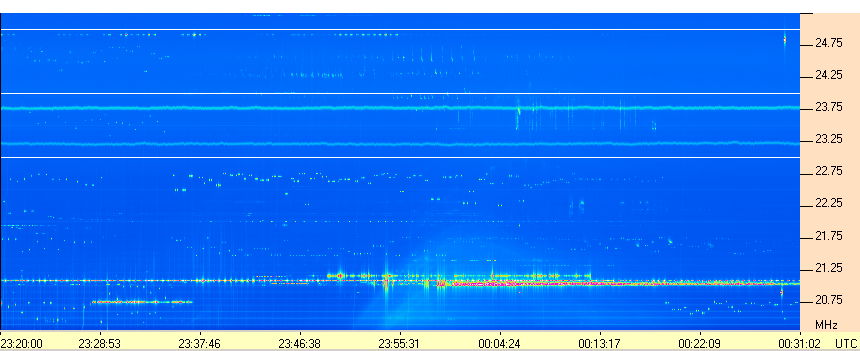
In the second spectrogram an estimate of the background is subtracted from the spectrogram so that the background is flattened, allowing the gain to be increased, in this case by a factor of three, bringing out (the brighter portion of) the TP.

The third and last spectrogram of this TP has the gain increased by a factor of 20. This brings out extensive fainter structure while washing out the brigher portion of the TP.

Notice the striations in the extended structure, which is a common theme in TPs.
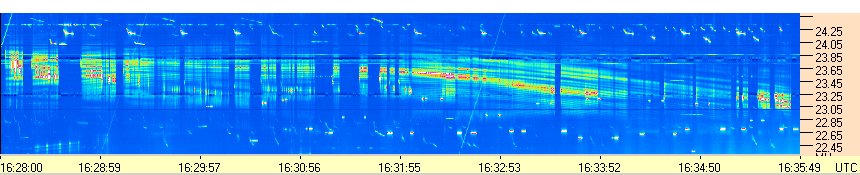
The next example is intended to show in more detail the striations and temporal structure. The latter relates to the hypothesis that TPs are unresolved lightning strokes, sprites, or emission by leaders advancing in cloud, while the former may relate to interaction with the ionosphere.

In this spectrogram there is a diffuse TP on the right half, which will not be discussed. Centered on the spectrogram is a broad and tenuous TP where its peak in not visible. Roughly in the center is a smaller structure shown in the next spectrogram, which clearly shows both arcing striations, and interesting temporal structure. There are gaps in the emission while there is continuity of the striations.
The next two spectrograms are from different times and at the full 10 Hz spectrum rate, showing gaps on small time scales
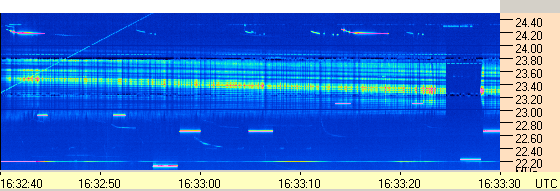

So these resolved data may support the unresolved-strokes hypothesis.
But resolving strokes in the striations is not a sure thing. The event in the next spectrogram is such a case. The insets show short segments at the 10 Hz rate, except for the bottom inset. In none of the insets is there evidence of temporal microstructure.
 This does not disprove the unresolved-strokes hypothesis, just that they are not resolved at 10 Hz. But with a digital receiver, the spectrum rate can be readily increased by a large factor, limited only by the declining signal-to-noise ratio. On the other hand, if increasing the spectrum rate does not resolve the striations, then another emission mechanism may be at work.
The point of this note is not about the interpretations I've injected into it or how right or wrong they might be, but that data such as these from digital spectrographs allow more hypothesis testing and more detailed interpretations to be formulated. There is typically a log going on in our spectrograms, particularly so with more sensitive receivers.
Nathan Towne
2/23/2021