GEOG 5223 Project 6 | |
Database Design | |
by Tom Wells - November 2003 | |
| Fig.1 - Total Registration |
Freely available census data and contrived voter data
pertaining to the city of Fitchburg in Massachusetts are utilized in this
project. The voter data
is summarized and compared to US 2000 Census block data. Specific results
are presented in three thematic maps and one table.
This project is designed to answer the following three question. The premise is that; "the local chapter of the Whig party wants to maximize turnout at the city's voting booths. In the past, they have distributed "Vote Whig!" flyers evenly across the city, but this year they would like to post them strategically in areas that have below-average registration numbers".
Having used many database system, I found the project's spatial join most interesting. In this case, voting data was summarized by census block groups. Voters were related to property center locations which were then spatially joined to the block group polygons. Besides finding points inside of polygons, ArcView can also perform spatial joins by finding the nearest feature, or finding what intersects a feature. |
|
The three Thematic maps shown below were developed after multiple data manipulations too numerous to list here. In summary, data manipulation steps include:
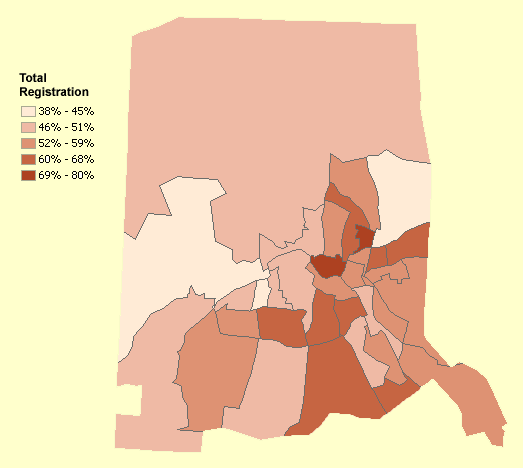
Then the three thematic maps were created from the summarized data set using ESRI ArcView 8.3's ArcMap application. Total Registration In Figure 1 below, voter registration is presented as a percentage of the total year 2000 population for each US census block area in Fitchburg, Massachusetts. This figure can answer the first question listed above. The lightest colored areas represent the lowest percentages of registered voters. Three census blocks fall in the lowest category of voter registration; 38% to 45%. One block is centrally located on the far eastern side of town whereas the other two blocks are centrally located on the western and far western side of town. Because the total population was used to normalize the voter registrations, instead of considering just those of voting areas, voter registration is limited to significantly less than 100 %. Still, some areas have ~ 80% voter registration on this basis. | |
| |
| Figure 1: | Total Voter Registration as a Percentage of the Year 2000 Census Block Population in Fitchburg, Massachusetts. Note: the city limits are 7.3 Kilometers wide (east-west) at the mid-point (north-south). |
|
Figure 1 was created after many steps as summarized above. However, the following Figure 2 was relatively easy to create because it uses the same data set as Figure 1. The second figure considers different data fields that are also included in the voter and census data. (The different data fields were summarized using a different approach as discussed under Comments below.) Note: ArcView 8.3 makes it easy to copy and paste a layer / map and then modify it for different purposes. The trick is finding the "Paste Layer" command by right-clicking the name of the data frame. Instead of summarizing the total voter registration versus the total population for each census block, Figure 2 shows the Hispanic voter registration versus the Hispanic population in the US 2000 census block data (regardless of political party). This thematic map also displays the number of Hispanics in each census block because a percentage has little significance if hardly anyone Hispanic lives there. Indeed, one census block, approaching the south west corner, has no Hispanic residents and consequently the percentage of Hispanic registrations is zero. The level of Hispanic Voter Registration is significantly lower than the overall-all average level of resident voter registration shown in Figure 1. The mid-range registration percentages are about one-half for the Hispanic residents compared to the total (all ethnic group) voter registrations (based on the US 2000 census block data). The overall calculated results shown in "Figure 4" indicate that Hispanics in this city have below half of the total 2000 population voter registration level calculated for all ethnic groups; 23 % versus 54 %. Regarding the second question listed above; if many of these unregistered Hispanic voters can not read English, then Spanish Language flyers may attract their attention to the Whig political party. Advertising could be most effective in the more densely populated Hispanic areas with particularly low voter registration percentages. For example, the census block near the center of the map with 66 Hispanics has less than 18 % registered. There are also three census block areas with more than one-hundred Hispanics and less than 26 % registered to vote. All four of these census block areas are relatively small and therefore easier to cover with flyers than the larger census blocks. (In general, the census block areas have similar populations with some exceptions. See Figure 3.) |
|

|
|
| Figure 2: | Hispanic Voter Registration as a Percentage of the Hispanic Year 2000 Census Block Population in Fitchburg, Massachusetts. Note: the city limits are 7.3 Kilometers wide (east-west) at the mid-point (north-south). |
|
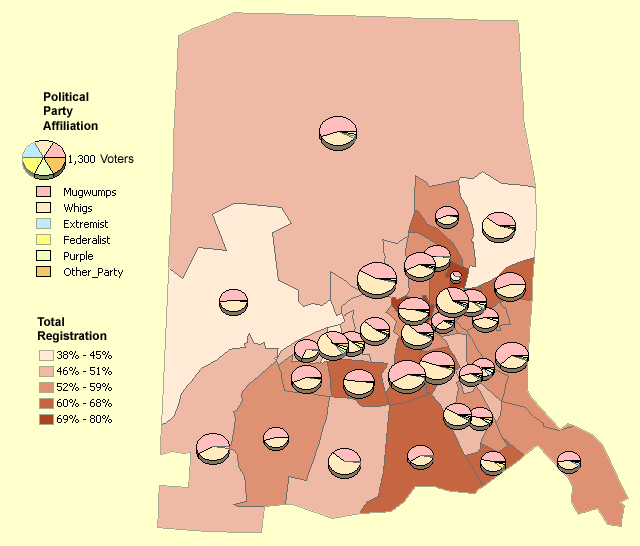
The third thematic map shown in Figure 3 below adds Political Party Affiliation 3-D pie charts to the Figure 1 thematic map. Each census block has its own pie chart and the size of the pie indicates the number of registered voters (with the size shown in the key representing 1,300 voters). This combination lets the viewer consider both the degree of voter registration and the political party affiliations in the same thematic map. However, the figure size shown (to fit a modest computer screen) does not show the party data well. The minority political parties are particularly hard to consider. The figure does show basically a two dominant party system; the Mugwumps versus the Whigs. The Mugwumps appear to be somewhat "stronger" than the Whigs in the less densely populated areas but there is no obvious clear pattern to party dominance (to answer the third question listed above). |
|
|
|
|
|
Figure 3: |
Political Party Affiliations and Voter Registration as a Percentage of the Total Year 2000 Population in Fitchburg, Massachusetts. Note: the city limits are 7.3 Kilometers wide (east-west) at the mid-point (north-south). |
|
ArcView is able to summarize tabular data to a limited degree. It is only able to group on one field at a time but it can summarize other fields at the same time. This capability was utilized to have ArcView numerically sum multiple fields of interest for the entire dataset. The trick is picking a field that does not vary as the field to be summarized. (Hence the grouping produces one row with the one content value.) In this case the state code was selected as the group field because every census block in Fitchburg is in the same state of Massachusetts (#25). Two numeric (double) fields were added to the single row summary table shown in Figure 4; Pct_AllEth and Pct_Hisp (Percent All Ethnicities and Percent Hispanic). The percent registered Hispanic voters was calculated as 23 % (Sum_Reg_Hispanic / Sum_Hispanics * 100). The all ethnicity percent of registered voters was calculated as 54 % (Sum_Reg_Total / Sum_POP2000 * 100). |
|
|
|
|
|
Figure 4: |
Summary of the "Total Registration" attribute table as saved as "Pct_Voters" (Percent Voters). Two calculated fields were added: Pct_AllEth and Pct_Hisp (Percent All Ethnicities and Percent Hispanic). |
|
This project has again shown that ArcView 8.3 can benefit from usage with Microsoft Access. Instead of summarizing the number of voters in each political party using ArcView/ArcMap's limited summary tool (and many steps), I used Microsoft Access 2000 to do so. Only three queries (shown below) were required to obtain the required summary data in a "Party_Count" table. The following CrossTab Query can summarize all of the political party information is a single short SQL statement (instead of requiring a separate operation for each Party like ArcMap does). The "PIVOT PARTY" syntax produces an output column for each political party.
The next query was used to make the summary query into a table:
Note how the NULL values are converted to zero and how an additional field is added; Reg_Total. The Reg_Total field was then calculated as:
Using Microsoft Access worked well with ArcView but I did find one limitation. At one point I added a field to an attribute table and found that the ArcMap summary tool could not "see" the addition. In order to enable the selection of the additional field in the summary tool, I had to recreated the feature class with the added field already in place. Apparently my personal Geodatabase field addition via Access did not add the information need by the ArcMap summary tool (into the "GDB_" prefixed GeoDataBase extension tables). | |
|
Sources | |
|
|
| Go To the Top of Page | |