This program acquires time-domain data from the SDRPlay receiver, computes spectra, and pipes the spectra to Radio Sky Spectrograph (RSS). The former is a software-defined radio (receive only) covering frequencies from near zero to about 1.7 GHz and having up to 8 MHz of useful bandwidth. The latter is a spectra acquisition and display tool (Windows based) used by the Spectrograph Users Group (SUG), a group affiliated with the Radio Jove. Besides piping integrated spectra to RSS for live display, the program can also save integrated and full-rate spectra to RSS's native SPS files, and also save time-domain data to binary files.
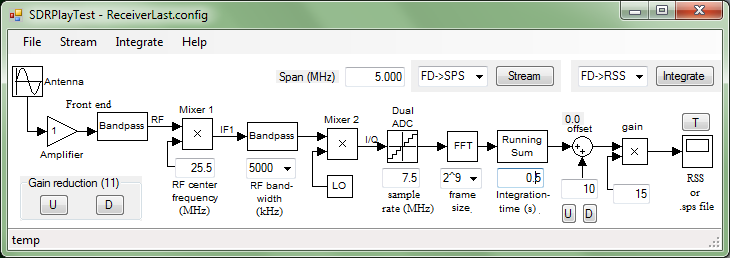
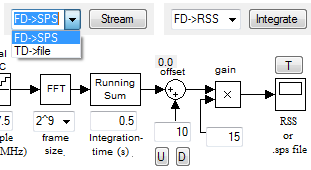
Please refer to the screen shot of the program window. In that figure the antenna, amplifier, and first bandpass blocks depict the installation's antenna and rf signal conditioning. 'Mixer 1' in the SDRPlay receiver sets the rf center frequency, which is followed by a band-pass filter, which sets the analog bandwidth to be processed. IF1 is a roughly 200-MHz IF frequency. Mixer 2 translates IF1 to I and Q base-band signals, which are then quantized by the dual ADC and transported to the host computer via USB2.
FFT and further processing are done by the computer. The frame size under the FFT block sets the sample count that are Fourier transformed as a block. The running sum depicts the channel-by-channel absolute squaring of the Fourier transforms and their accumulation. There is a great deal of data reduction in this accumulation. The offset and gain are applied to each integrated frame (each spectral channel), and the result is passed on to RSS. This is the baseline functionality of SDRPlay2RSS.

This baseline functionality is initialized by the 'Integrate' button. When armed in this way, the button's color is yellow and RSS acquisition may be started and stopped using RSS's start button repeatedly without rearming. Hit the 'Integrate' button again to disarm (and stop RSS acquisition if acquiring).
Most receiver settings must be set prior to arming. To change these settings, one must disarm SDRPlay2RSS if armed, change the setting(s), and then rearm. Exceptions to this rule are the gain reduction, offset, gain, windowing, log scaling, and switched-mode pause time, which may be changed on the fly. The configuration can be also saved on the fly, but not loaded.
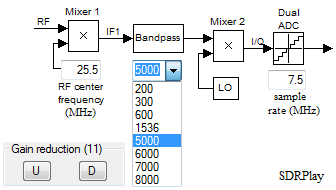
There are four SDRPlay settings (see the next figure).
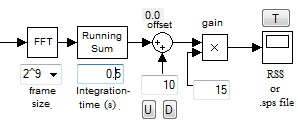
Computer processing starts at the FFT block, where the time-domain data are Fourier transformed. The first setting is the Fourier frame size N, in the figure shown at 29. The drop-down box allows selection of a power of two. A fundamental relation is that the spectral resolution Δf is
Δf = fs/NThe absolute squares of those transforms are then computed (not shown), and integrated by the 'running sum' block for the interval entered in the 'integration time' box.
Although the SUG typically uses 0.15-s integration times for Jupiter and solar observations, much longer and shorter times can be used. The low end is limited by the computer and RSS being able to keep up with the data rate. Five-millisecond (0.005 s) integrations result in useful spectrograms on my computer. The high end is limited by the buffering required. See the notes below.
The offset setting may be adjusted on the fly using the 'U' and 'D' buttons. They increment and decrement, respectively the offset by the adjustable increment in the box just above the buttons. The current value of the offset is displayed above the offset block. The gain may also be adjusted on the fly by entering a value in its box. You must hit carriage return to register a new gain value.
The 'Span' setting sets the frequency span of the spectral channels that are actually sent to RSS or otherwise recorded. When the RF bandwidth is changed the span is set to its default, which is the rf bandwidth. But it can subsequently be changed to other values that are not more than the sample rate. The actual number of channels nRSS sent to RSS is
nRSS = Span/fs × N
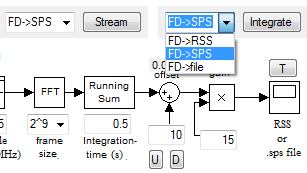
RSS is able to accept integrated spectra at a rate in excess of 100 Hz (10-ms temporal resolution) on my computer. This rate can be exceeded by streaming integrated spectra directly to .sps files (and later opening the files using RSS). This is done by selecting the 'FD->SPS' option of the selector associated with the 'Integrate' button. Integration times down to the unintegrated rate (fs/N) can be handled this way.
The duration of acquisition saved to a file is the 'Integrate record time' figure of the 'Integrate' menu.
Streaming without integration is used for the highest temporal resolution (N/fs). It is started using the 'Stream' button using its default 'FD->SPS' selection. Like with integrated streaming, the data file is of the SPS format, and SDRPlay2RSS streams to each file for the duration specified by the 'Streaming record time' menu item under the 'Stream' menu. Once activated, spectra are written to new files until the 'Stream' button is pressed again. File volume piles up quickly in this mode, particularly at high sample rates.
Note that in unintegrated acquisition, the temporal resolution and time resolution are reciprocals of each other.
Δt = 1/Δfwhere Δf is given above.

Note that while this spectrogram of S bursts illustrates fast streaming of Fourier frames to disk, S bursts can also be captured using integration to disk (FD->SPS) with integration time of ~1 ms. The advantage is that the integration reduces the file volume by more than an order of magnitude. Where the full temporal resolution might be needed is, for example, for resolving emission by lightning.

There is a simple facility for setting a background spectrum and subtracting it from the spectrogram as it is being acquired. When the 'background subtraction' menu item under the integrate menu is clicked, it averages the next several spectra to determine the background to be subtracted. The program subsequently subtracts that background from spectra before they are sent to RSS or to a file. The number that are averaged is set by the 'background count' menu item. Once enabled, the menu item 'bgr' appears, which when clicked refreshes the background.
This capability is necessarily a bit clumsy and an otherwise imperfect technique. One must start the averaging not knowing that the roughly empty background at the start of the averaging will persist. And it abandons an antenna-temperature calibration, if implicitly present. But it is nevertheless useful at times for bringing out faint features.

Spectra may be delivered with either linear or logarithmic scaling of intensities. The log setting is useful for displaying a larger range of intensity scales, including down to the noise level of the spectra. Select one or the other using the 'Log scale' menu item under either the 'Integrate' or 'Stream' menu. Changes to this setting may be made on the fly (no restart needed). When in the logarithmic mode, the offset (offset block) is measured in decibels. To display many decibels in RSS, a small value of the gain is generally required to reduce the scale. The log-scale setting is saved and restored in configuration files.
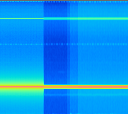
A block-by-block Fourier transform has a sinc-function response with its characteristically long 1/f tails. Around strong lines, these tails spread into nearby fourier channels, often obscuring them or at best contaminating them. The problem is often especially evident when the spectra are logarithmically scaled. A window function has the effect of suppressing those long tails. The price paid for this benefit is widening slightly the central peak. These effects are illustrated in the spectrogram to the right, where to the left of the gap no windowing is applied, and on the right it is applied. The lower line shows the suppression of the sidebands, and the upper line shows the widening of the line.
In SDRPlay2RSS, a Blackman window function is applied to the Fourier frames prior to the Fourier transform when the 'Window function' menu item under the integrate menu is checked. The setting is saved and restored in configuration files. Windowing can be applied in both streaming (non-integrating) and integrating modes.

As was mentioned elsewhere, the baseline Fourier processing divides the time-domain data stream into blocks that are individually Fourier transformed, absolute squared, and accumulated (integrated). A windowing function may optionally be applied to the blocks as a means to suppress artificial sidebands of intense lines, sidebands that arise from the blocking of time-domain data. This method is effective, but it also degrades slightly the spectral resolution.
SDRPlay2RSS can alternatively insert a filter ahead of the Fourier transform that has the effect of simultaneously suppressing those side bands and preserving the spectral resolution. This configuration is called a poly-phase filter bank (PFB). Engage the PFB through the 'Integrate' menu.
A few other facts about this function.
The graphs to the right show a 20-MHz test signal without and with the PFB engaged. The vertical scale is logarithmic and the span is something like 50 dB.
With SDRPlay2RSS version 1.0.19.0 or later SDRPlay2RSS will work with the RSP2 receiver. Among the differences you will see in SDRPlay2RSS will be a box for selecting the RSP2 antenna port - A, B, or Hi-Z. The A and B ports can be selected on the fly if one of these two was selected at the time acquisition was started. But the Hi-Z port can only be selected or deselected by the SDRPlay API when not acquiring. Another difference you will notice is that the B-port bias T can be switched on and off through the file menu.
With SDRPlay2RSS version 1.0.21.0 or later there is a new switched mode where alternate spectra are taken from alternating A/B antenna ports. This mode effectively makes the RSP2/SDRPlay2RSS/RSS a dual spectrograph, useful for recording dual-polarization spectra. There are a couple of limitations to note about switched mode. The first is that, because of the switching, each channel is only integrating half the time. The second is that there is no rigorous synchronization between the state of the antenna switch and the which channel is accumulating spectra because of the the unknown and variable buffing in various levels of software in the computer, such as the RSP device driver and the USB drivers. This unknown buffering amounts to many samples.
A workaround is implemented in version 1.0.22.0 with a parameter (accessed through the integration menu) that pauses acquisition between channel switches for a given number of ADC samples. No pause is added when not in switched mode or when running an RSP1. This pause adds a corresponding amount of dead time to the cycle, and you may wish to adjust the integration time to set a given interval between spectra. The pause interval is simply the number of pause samples divided by the sample rate. A pause value of 100k-150k samples seems to work well enough on my computer, but that judgement depends on the individual and the application.
Switched mode is not useful for short integration times and high number of spectra per second because then the pause interval dominates the cycle.
The state of the bias T and the pause interval are both recorded in and restored from configuration files.
The RSP2 works well for SID monitoring by recording VLF signal intensities using the high-impedance port. No amplifier is needed. Support for this capability is available with SDRPlay2RSS version 28 (1.0.28.0) and later. RSS is not used in this mode; line intensities are instead output to a file whose format approximates that of the Stanford SID data files.
My setup has a loop antenna consisting of 26 turns of 18-gauge wire wound on a one-meter-square spindle. It uses 13 turns of zip cord, spliced to double the number of turns. A length of the cord runs the signal into the house to the RSP2's hi-Z plug where there is a 0.08 µF capacitor across the antenna (experiment with this). There was evidence that there was excessive signal intensity (gain compression), so I also added a 1.5-kΩ resistor between one of the antenna wires and its hi-Z terminal (experiment with this value as well).
Transmitter intensities are output to a file with a header more or less like the Stanford SID file headers. More than one transmitter may be recorded to the SID file, which is currently fixed at NAA and NML, both in the file on each comma-separated line.
The observatory configuration window has an extension for configuring the SID transmitters to monitor. In that extension, the transmitters box lists transmitters that may be selected. Note that more than one can be selected, which is done by holding the control key while clicking transmitters. There is also a background box where a range of frequencies can be entered for determining a background level in spectra that is subtracted from the measured line intensities. Leave the box blank to not employ background subtraction.
Start with these SDRPlay2RSS settings:
To determine what transmitter signals are available, view spectra in RSS by selecting the integrating drop-down item 'FD->RSS'. Scope view under the RSS view menu is useful for this. When lines from the transmitters list are identified, select them in the transmitters selector of the SID configuration section of the observatory window. The NAA and NML transmitters are strong here in New Mexico, and NPM in Hawaii is usefully monitored as well. If employing background subtraction, select a nearby frequency range that is consistently free of RFI. You will have to experiment to determine if this facility actually reduces scatter in the measured line intensities.
Background subtraction can be helpful to reduce the scatter of the measured intensities when there is RFI that variably changes the level of the transmitter line(s). Lightning can do this, for example. It is not essential to use it. To use it, find a frequency span of the spectra that appears free lines, and enter that range in the background box of the SID configuration section in the format 'startfreqkHz-endfreqkHz'. This will engage background subtraction when a SID run is started, using that frequency span to estimate background.
A new file is created at the start of each UTC day. The following figure show a day's monitoring of two transmitters.

When monitoring the sun in the FD->SID mode, use about 20 kHz SID span. The configuration of SDRPlay2RSS is quite different in its settings to be appropriate to its 20.4-MHz frequency and ~30-kHz SID span. Be sure to check these frequencies by viewing the spectrum on RSS (FD->RSS) setting, and setting the SID span to not enclose any RFI that might be nearby. And do not use SID background subtraction when SID-monitoring the sun. When done with setup, switch back to FD->SID. I've been using an integration time of 0.5 second. With these settings the SID file should accumulate at a rate of ~10 MByte/day.
Sorry, I don't have software for displaying the SID data.
For more information see the SID Monitors page and the SID data access page at the Stanford Solar Center.
There is the ability to stream time-domain data (ADC samples) to disk at the full data rate. To use it set the streaming selector to TD->file and click the stream button. The files written have a 72-byte header followed by the samples. The header has the following structure:
The samples consist of a sequence of I/Q pairs. Each sample of each pair consists of a signed 12-bit word sign extended into its 16-bit word.
Samples are written to a single file and the file continues to grow until acquisition is manually stopped. This means that this mode of acquisition is not suitable for unattended operation. For example, at a sample rate of 12 MS/s, the file grows at a rate of 50 MB/s
Almost all of the settings of the program's user interface can be saved and restored. These settings are also saved when the program is closed, and restored when the program starts again. Use the file menu's 'Load', 'Save', and 'Save as' to load a configuration, save the configuration to the currently loaded file, and save to a new file, respectively. These files are saved and loaded from the program's current directory. They are human-readable ascii files made up of XML-tagged parameters. The program's current directory at run time should be explicitly set in the desktop icons and/or links that are used to start the program.
The idea of these configuration files is to customize settings for different kinds of measurements, including the directories to which data are written. For example, Jupiter measurements settings, incuding data directories, are saved to one configuration file, while meteor forward scatter measurements have settings and data directories saved to another configuration file, streaming settings for S bursts can go to a third, very high resolution settings for resolving lightning to a another, etc.
Paths to which spectrograms are written may be configured. There are paths for both integrating and streaming files, the former set through the 'Integrate' menu, the later through the 'Stream' menu. There is also a path for the observatory data accessed through the file menu, but its utility is questionable (just the path and not the data itself). These paths are saved and restored in configuration files.
regsvr32 mscomm32.ocx
The rf input does not require much signal intensity. It is easy to over power the input to the degree that it looks like there is no signal at all. I suggest that you insert sufficient attenuation at the input so that the working range of the gain-reduction setting is ≤ ~20 dB.
If you are new to SDRPlay, some patience may be needed while getting to know the receiver. There is a lot of analog processing happening in the device that can give rise to harmonics, mixing products, and images in crowded frequency spans. It takes time to acclimate to the signs and learn to best manage these issues while preserving sensitivity.
Thanks to the people who have provided bug reports and suggestions for new capabilities.
Thanks to Jim Sky for his RSS.
FFTW is a capable Fourier-transform package used by SDRPlay2RSS.
Nathan Towne
towne56 at ownmail dot net
8/19/2017