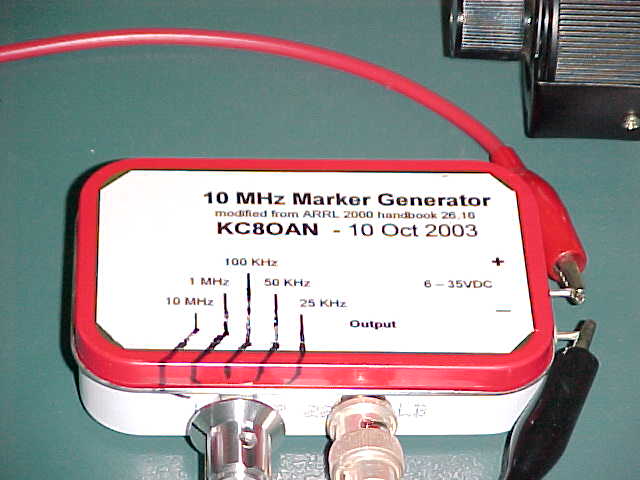
A Marker Generator with narrow pulse output.
A recently added project ( Oct, 2003 ), this marker generator is a modified version of the generator in chapter 26 of the 2000 ARRL Handbook. Oscillator frequency has been changed to 10 MHz ( to allow easier pinpointing of a signal within the Spectrum Analyzer's full span ).
 click on image for larger version
( note: Altoid's boxes sure are handy, aren't they? )
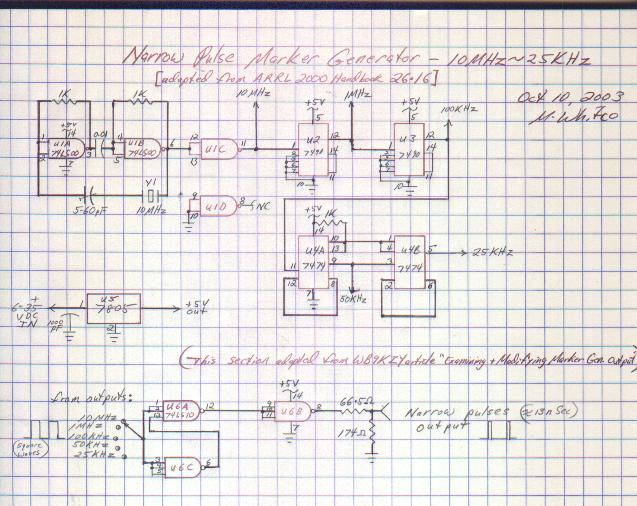
The circuit layout has been rearranged so that directly out of the oscillator section, 10MHz is available. This is followed by a 7490 chip to divide by 10 to give 1MHz, then another 7490 for 100KHz. The last 2 division sections are two halves of a 7474 flip flop, each dividing by two. Thus the 50KHz and 25KHz outputs (schematic shown here ). This is before the narrow pulse modification (next).
 click on image for larger version
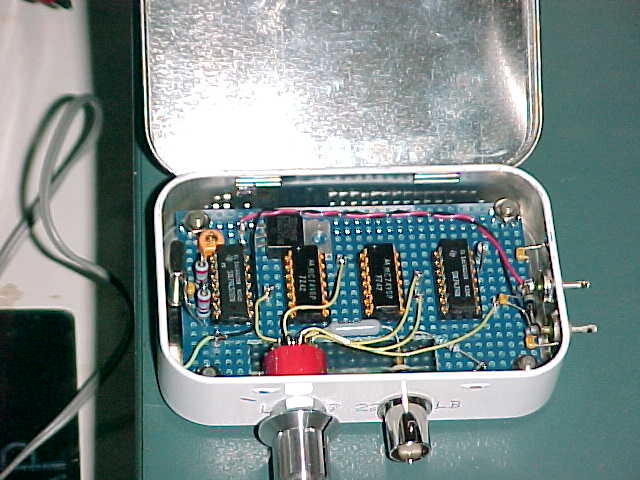
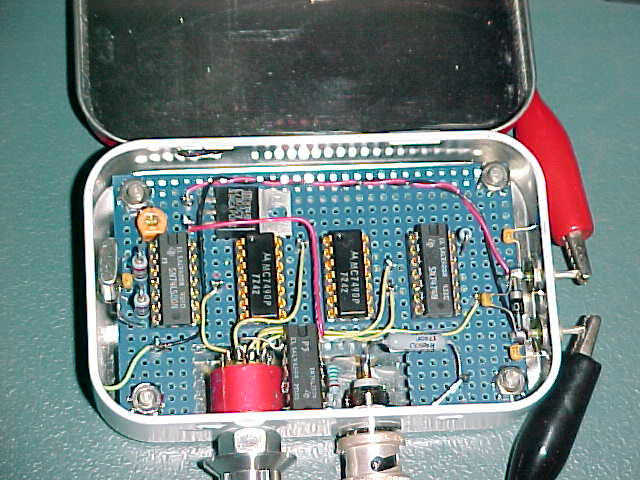
The narrow pulse generator circuit (the chip added in the image below, between the selector switch and the BNC connector) is a modified version of WB9ZKY's circuit found at jacksonharbor.home.att.net/markers.pdf (note: requires Adobe Acrobat Reader to view). Rather than using the 74HC132 which I could not find locally, a 74LS10 triple 3-input Nand gate fit the bill quite nicely giving about a 13 nSec pulse width at all marker rates. This is shown in the schematic as well.
 click on image for larger version
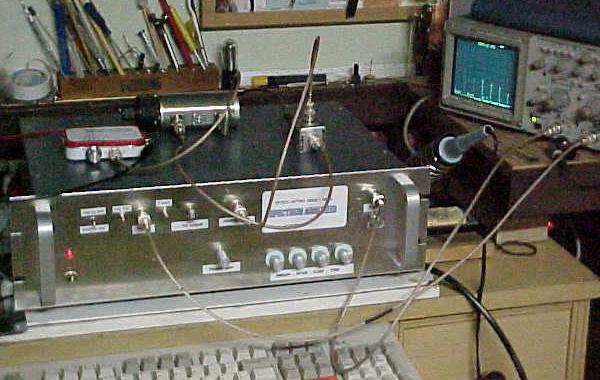
The marker generator is shown below (what a mess...hi) connected through a step attenuator and into a homebrewed return loss bridge (hybrid combiner). Also connected into the RLB (but not visible here) is a Leader signal generator set at 7.041MHz. Detector output of the bridge is connected to the Spectrum Analyzer, with the output being viewed on a Tek 2232 scope.
 click on image for larger version
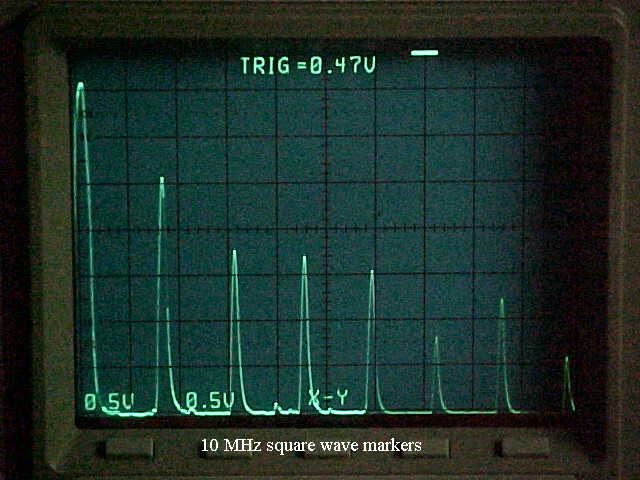
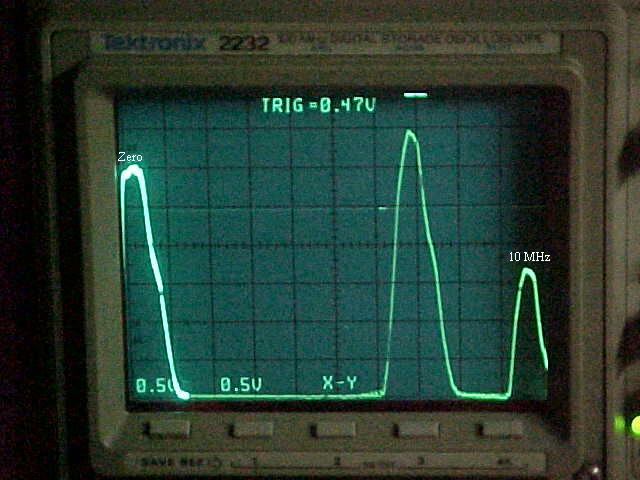
Here is a view of the 10MHz markers (no 7MHz signal added yet) before the narrow pulse mod , showing uneven amplitudes...
 click on image for larger version
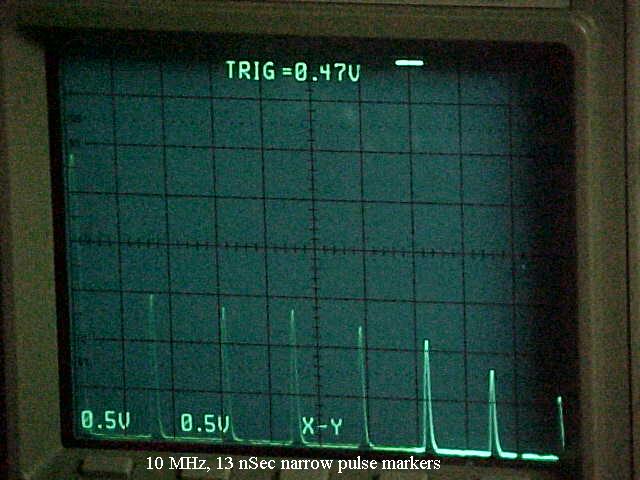
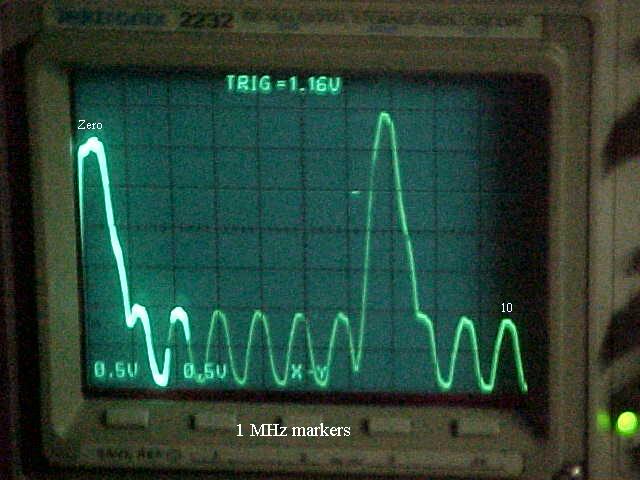
and a view after the mod has been made showing more linear (with less drastic height variation) markers.
 click on image for larger version
Adding the 7.041MHz signal gives the following response: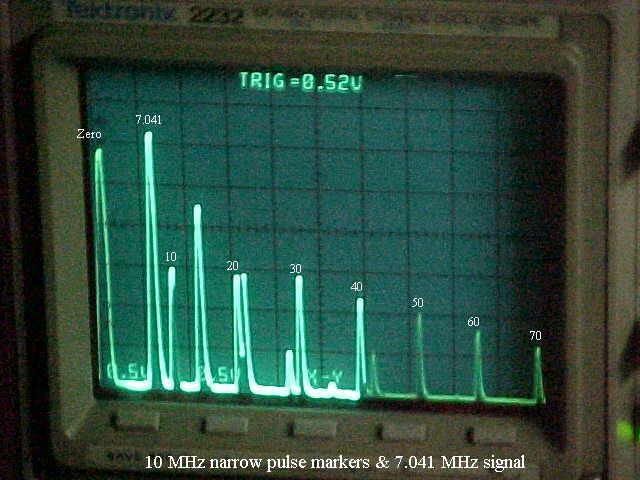 click on image for larger version
Reducing the span control on the analyzer to show only the range from the zero spur up to the 10MHz marker gives a better view (below) of the 7.041MHz signal (note: resolution bandwidth is at 300KHz).
 click on image for larger version
Next is a view of the marker generator switched to 1MHz markers, to allow a better identification of the 7.041 signal.
 click on image for larger version
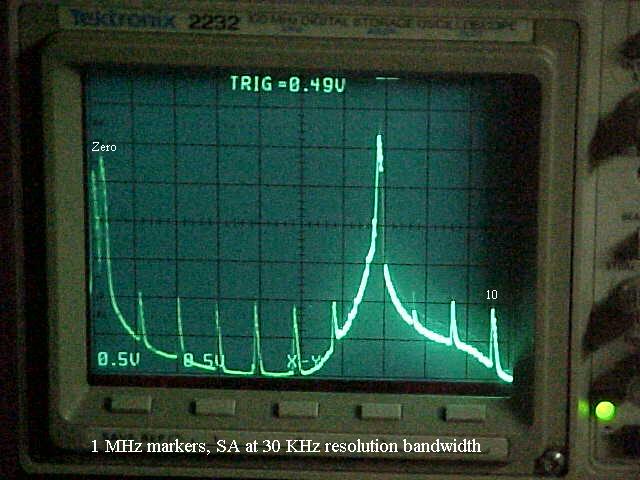
At this point I will switch to the 30KHz resolution bandwidth, but still showing zero to 10MHZ with the 7.041 signal in amongst the 1MHz markers.
 click on image for larger version
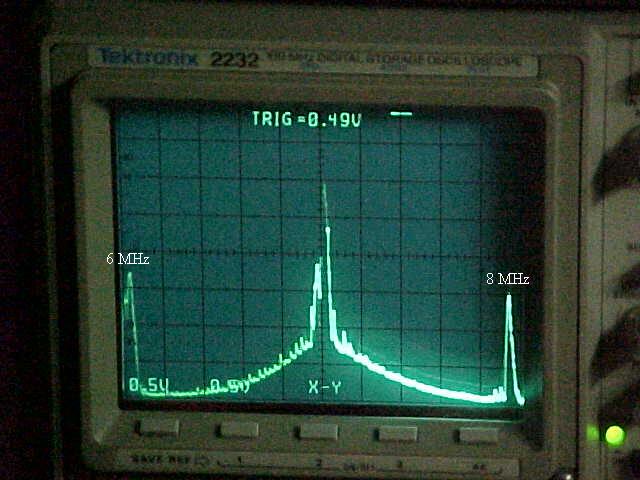
Reducing the span further, to show only 6MHz to 8MHz allows a more "zoomed-in" view as seen below
 click on image for larger version
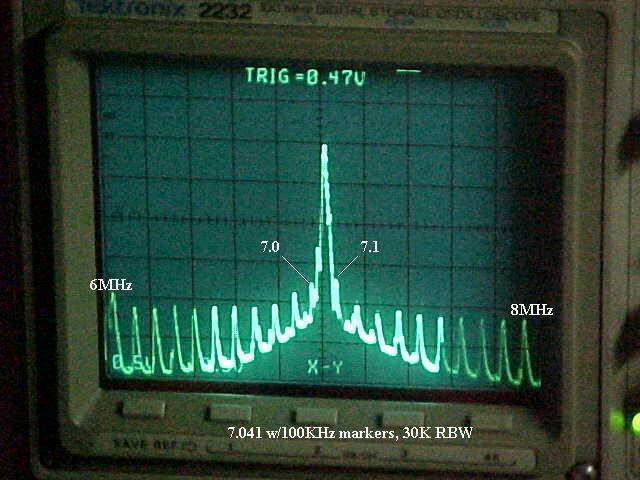
Going to 100KHz markers gives a better idea of the signal location as seen below, and although exact pinpointing is not possible, the 7.041 signal showing up between 7MHz and 7.1MHz gives a pretty good identification of the signal's frequency.
 click on image for larger version
So, hopefully this explanation through the process of applying markers and adding the signal of interest, to allow pinpinting and viewing of it will be of interest and help to others who may have the desire to homebrew, or to simply understand the functioning and application of such equipment.