
Sub-Aqueous Sand Cap Surcharge Placement Sub-aqueous
capping is performed on environmental remediation sites to isolate contaminated sediments from the
surface environment. This construction method can also be employed on projects
involving construction on submerged soft sediments to build up a firm and uniform underwater work surface. Sub-aqueous caps are essentially "sprinkled" into place underwater with minimal disturbance to the underlying soft sediments and can be placed evenly from floating platforms either
hydraulically or mechanically. Mr. Wells's QA/QC system has been used with the
two hydraulic placement barges, as pictured below. Sand is mixed with water
and pumped to a placement barge where baffling and screening controls the sand's
outflow. The system could also be used with a mechanical placement
system, provided
that an electronic scale can monitor the flow of capping material. In 2004, on behalf of environmental contractor
Envirocon,
Tom was asked to propose a QA/QC system to help guide and document a sub-aqueous
sand capping operation at the
St. Louis River Interlake Duluth Tar Superfund
site in Duluth, Minnesota. Envirocon was awarded the general construction
contract for placing a sand surcharge on impacted sediments in Stryker Bay,
Minnesota in 2006. Tom designed, built, implemented and operated the
original sub-aqueous capping QA/QC system that year. The 2006 environmental construction task placed 58,755 tons of
man-made sand under water on 11 acres of tar-contaminated sediments. The sand
was pumped 2,600 feet from shore to a placement barge operating in shallow
water. Once the sub-aqueous cap was completed, additional sand was placed
temporarily using conventional land-based methods to compress the contaminated
sediments. Starting in 2009, that temporary sand layer was removed to
recreate the original bathemetry. Some of the equipment and programming involved is discussed
below. Note: The sub-aqueous capping system was also utilized in 2009 and
2010 to help guide and document capping in Slip 6 near Stryker Bay, MN.
(Slip 6 has become the CAD; the Contained Aquatic Disposal area.) The main
QA/QC program was modified in 2009 primarily to deal with a different conveyor belt
and more importantly, a different brand belt scale (with a similar but different
integrator / controller).
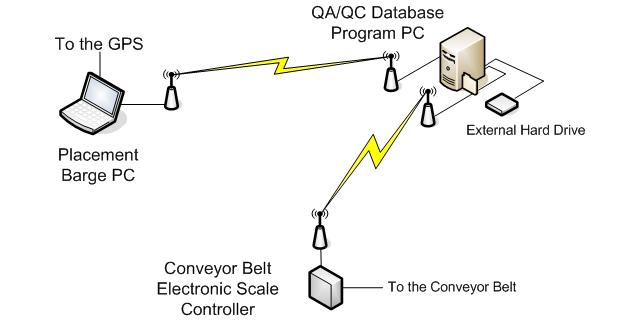
As shown by the connectivity diagram below, the QA/QC system utilizes two wireless links: one connects the QA/QC PC
to the placement barge; the other connects the QA/QC PC to the stationary
conveyor belt scale controller / integrator. The sand feed rate is
obtained from the conveyor belt scale and used to calculate the target placement
velocity for the desired thickness. This target velocity can be
transmitted for visual display to a PC on the placement barge or elsewhere. Both the scale and GPS data streams
are stored in a multi-user database on the QA/QC PC by the main "Cap
QC" program discussed below. Microsoft®
(MS)
Excel and Visio were used to generate tabular and graphical reports from the
shared MS Access database. (See REPORTING below.)
The two-way wireless link to the placement barge was also used to simultaneously
track the barge's location in real-time at the
QA/QC PC Trailer. (See REAL-TIME TRACKING
below.)
In 2006 the GPS data was converted to state plain coordinates by HyPack, a
hydrographic surveying program, running on the Placement Barge PC. (The
wireless link from the Placement Barge to the QA/QC PC was a two-way Ethernet
based link in 2006.) In 2009 and 2010, the GPS data was converted to state
plain coordinates by CableVision, a commercial dredging package, running on an
additional PC in the
QA/QC trailer. (The wireless link from the GPS to the CableVision PC was a
one-way RS-232 based link in 2009 and 2010.) The CableVision PC was also
used for real-time placement barge tracking.
In both cases, the processed GPS data was transmitted via a Local Area Network
in the QA/QC trailer to the main QC program for storage in a MS Access based
multi-user database.
In 2006 a Belt-Way Scales, Inc. brand conveyor belt scale was used with their
standard controller / integrator. In 2009 & 2010 a
ConveyWeigh, LLC
brand conveyor belt scale was used with their standard controller / integrator on a
different conveyor. Both controllers utilize an RS-232 serial interfaces
for communication with 3rd party systems such as the Sub-Aqueous Capping QA/QC
System. The Belt-Way controller can be set to output scale data every minute or
scale data output can be requested by transmitting a code to the controller.
The ConveyWeigh controller simply outputs scale data approximately every second.
During all three sub-aqueous capping construction seasons, both scale and GPS
data was captured approximately every 9-10 seconds. Consequently, the
capping QA/QC program was programmed to request a reading from the Belt-Way
controller every 9 seconds and allow 1 second for the response. The
communication approach with the ConveyWeigh controller is to simply look for
data every 9 seconds and if the data is incomprehensible due to the lack of data
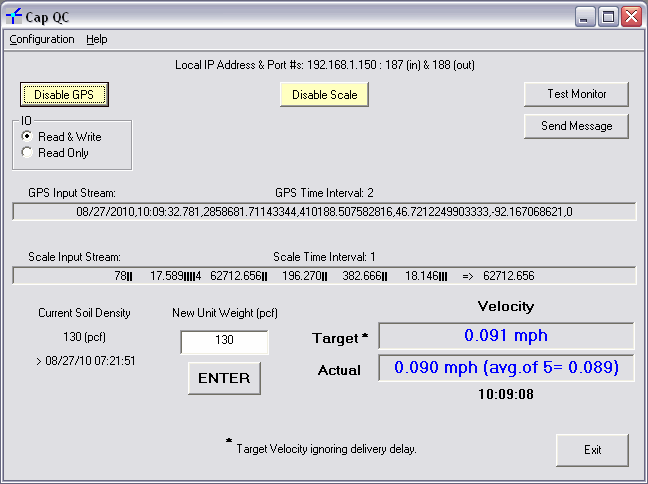
flow control, then the next data set would be captured one second later. During capping operations, the main Cap QC program runs
continuously on the QA/QC PC capturing and storing two data streams; placement
barge location and capping material conveyor belt scale readings. Both raw
text data streams are shown on the main program form below (including some
unprintable ASCII characters as vertical bars). The following screen shot was captured 8/27/2010
at 10:09:32.781 according to the GPS data stream. According to the Scale
Input Stream, the scale had totaled 62,712.656 tons of capping material at this
point. The 2010 version of the Cap QC program calculates the actual
placement barge speed as well as the calculated target velocity based on the
capping material feed rate. (The actual velocity calculation and display
was added because the GPS used in 2009 & 2010 did not supply the actual
velocity within the GPS data stream.) The target velocity is the placement
speed that will produce the desired lift thickness based on the feed rate,
placement width and the capping material unit weight.
The target velocity can also be transmitted to the placement
barge for display on a PC running the QC Monitor program (and other programs
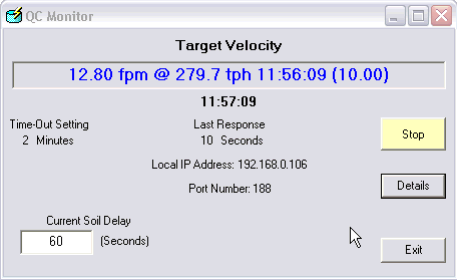
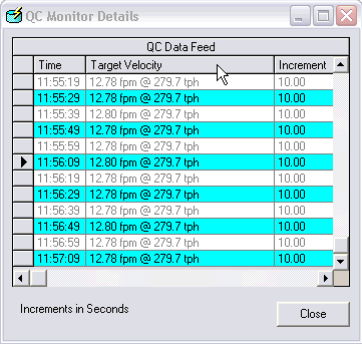
such as HyPack, a hydrographic mapping program). An example of the main QC
Monitor form and the QC Monitor Details form are shown below. The QC
Monitor program displays the target velocity after the use specified "Current
Soil Delay". In the 2006 example shown, target velocities are calculated every
10 seconds and displayed after a 60 second delay to account for the travel time
from the scale to the placement barge. Hence the 11:57:09 target velocity
was received last but the 11:56:09 target velocity is displayed to the operator
on the main QC Monitor form.
Computerized QA/QC System
INTRODUCTION
The 2006
Placement Barge Operating in Stryker
Bay, Duluth, MN.
MCM Marine, Inc. was the Marine Contractor.
The 2009 / 2010
Placement Barge Operating in Slip
6, Duluth, MN.
MARINE TECH, LLC was the Marine Contractor.
Some of the
sand placed on site. Reddish sand was used too.
The partially hidden 60 ton off-road truck looks tiny compared to the pile.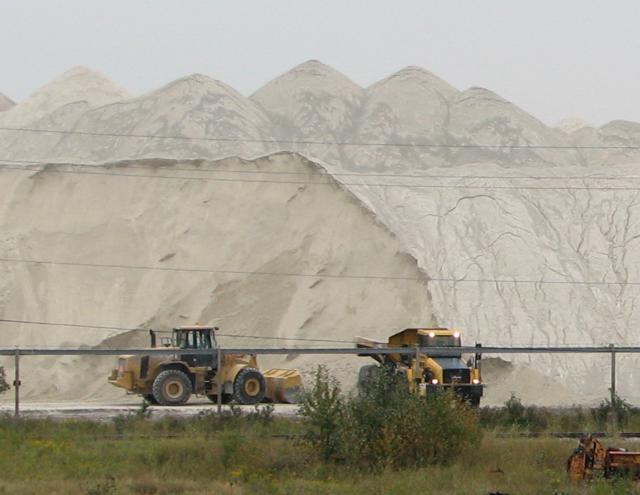
SYSTEM LOGIC
GPS DATA PROCESSING
CONVEYOR BELT SCALES
QC PROGRAMS
 |
 |
The main QC program stores the GPS and scale data in a MS Access database that can be accessed by multiple PCs simultaneously even while new data is being added to the database file. This multi-user capability allowed for the creation of a MS Visio based real-time placement barge tracking system. The following partial screen shot shows the system in action drawing the placement barge's path in the CAD on August 28th, 2010. The red placement barge tracks show how the crossed out area was avoided (once the cables were marked).
![]()
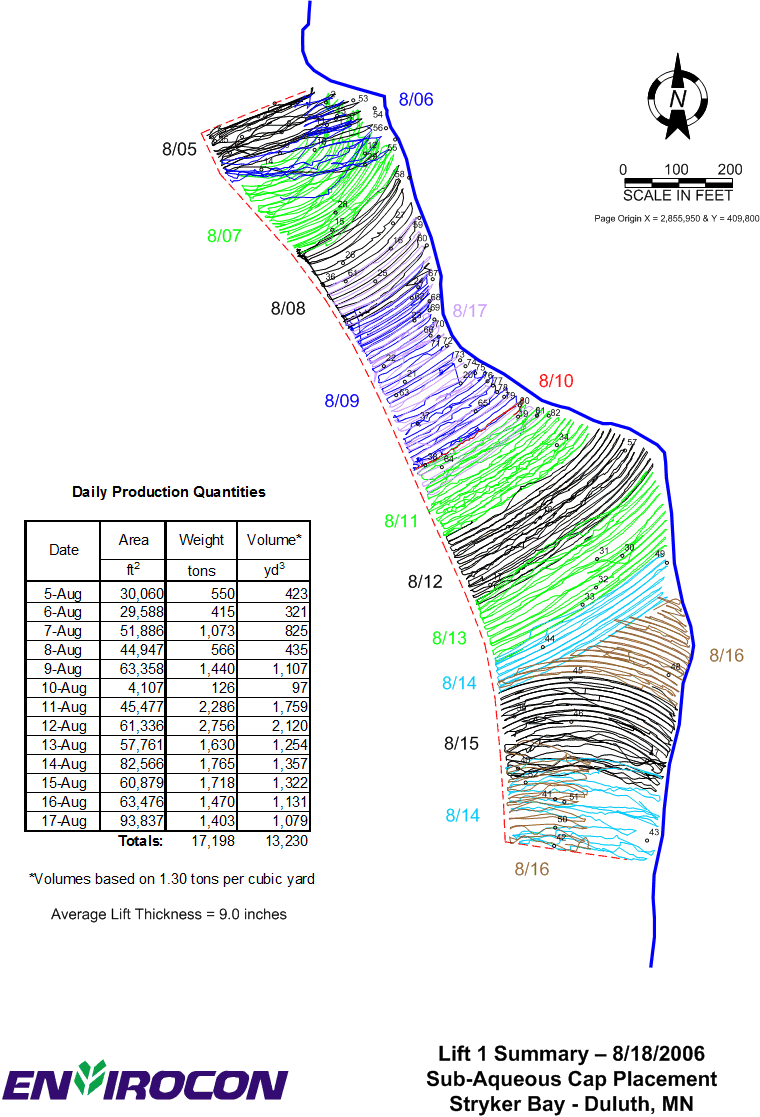
Daily sand placement reports were generated during each 2006, 2009 & 2010 construction season. Microsoft Visio was also used to produce, weekly reports, tracking reports, and lift reports based on the captured data. An example lift summary report is shown below from 2006.
