Don Munsil's Financial Data & Spreadsheets
These are all spreadsheets and tools I've put together to answer various questions about investing in different asset classes. I make no guarantees about the accuracy of the data or the spreadsheet coding. The data has all been obtained from publicly available sources.
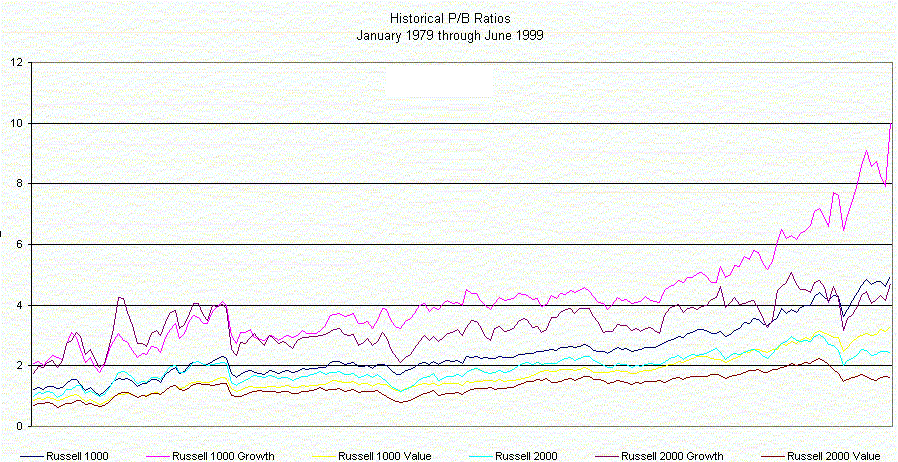
Russell_PB_Ratios.gif is a graph of the Price/Book ratios of the Russell 1000, 1000 Value, 1000 Growth, 2000, 2000 Value, and 2000 Growth, from 1979 to 1999, quarterly & monthly (the first 5 years are quarterly, and the rest is monthly, so the scale shifts partway through). This graph comes from the Frank Russell company.
3 Assets 60-03 This is a look at Stocks (S&P 500), Bonds (Aggregate Bond Index), and Cash (not sure), all obtained from Vanguard. The data is annual from 1960 to 1998, and I calculate Annualized Return, Standard Deviation, Worst Return, Worst Predicted (<5% probability), and other stuff. You can enter weights for the three assets, and see how that portfolio would have done, assuming annual rebalancing.
9 Assets 73-03 Similar to above, asset returns mostly from DFA, with 9 assets including Small Value, Large Value, Short Bonds, Long Bonds, etc. Has the same basic inputs and outputs. I made a stab at estimating post-tax returns, but for heaven's sake don't use this for tax planning; I made some very simplistic assumptions to get a ballpark guess.
Strategy comparison This is a comparison of a simple momentum strategy to allocate new money to one of two indexes, in this case Wilshire Large Cap 750 and Wilshire Small Cap 1750, to a contrary strategy. The momentum strategy is to put new money into the index that had the highest return last quarter, and the contrary strategy is to put money into the index with the lowest return last quarter. Two non-timing strategies and raw returns for the two indexes are also there. Also contains quarterly total returns for the two indexes going back to 6/29/78.
PB strategy comparison A similar comparison to the above, but using annual numbers, and making the momentum/contrary decision based on the relative Price/Book ratios of the two indexes. P/B and total return numbers are direct from Wilshire.
A cautionary note: the above spreadsheets (especially the last 2) are great for data mining. With them, you can "prove" that you should always buy the index that did best, or did worst, or whatever. But what they're really supposed to show is that simple momentum or contrarian strategies just add volatility without adding expected return. Or at least that's my interpretation. If you glean something more from them, please let me know. :-)
All of the spreadsheets are built with Excel 97, and most of them use functions that are in the Analysis ToolPak, which comes with Excel (it came with Excel several versions back, I believe). You may need to install it off your original CD-Rom. If you can't read these files with your version of Excel, let me know and I can send you or post versions saved in an earlier format. My email address is don@munsil.com. Also please email with questions, comments, corrections, kudos, complaints, and whatnot.