
The new Verilog module NetworkAnalyzer is mostly working now and producing useful data. Being resident in logic, it has access to signals internal to the rf controller, which allows for detailed characterization of the controller independent of design specifications and reverse engineering. While external analog network measurements are in some ways complementary to internal measurements, internal measurements have the advantage of more accurately measuring the system the control algorithm must control. The first set of measurements have turned out well and some results are given in this short report. While only the cavity input to the controller is measured here, all inputs and internal signals are accessible to the network analyzer in principle depending on the exact coding. Currently, the debug channel, the eight rf inputs, and five other unassigned channels are available for single-shot analysis, including the DDS reference. Any number of channels up to 15 may be instantiated. These measurements were done with only the DDS reference and the debug channel instantiated.
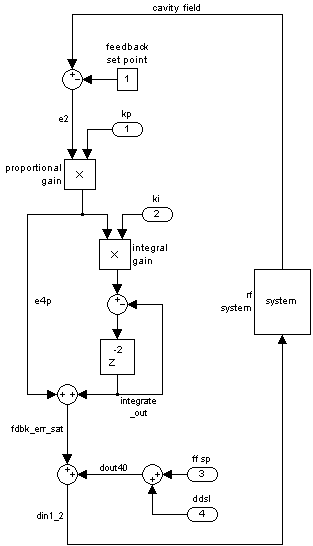
The diagram to the right provides context to these measurements, illustrating principal controller functions on the left, coupled to an rf system providing feedback on the right. Signal names are used throughout this report. Proportional and integral gains are shown. Note that the proportional gain adjustment is also in line with the integral branch. Feedback can be removed by switching off a switch at fdbk_err_sat (not shown), or by setting the proportional gain kp to zero. Much of the logic shown in this diagram is contained in the feedback module fb_loop. There is more detail about that block in its documentation, and it is useful to compare measured delays with that document.
During network measurements, the system is excited by the signal labeled 'ddsI' near the bottom of the block diagram where it is injected in parallel with the feed forward source. ddsI serves as the raw reference signal of the network analyzer, which means that the raw sine and cosine integrals as a complex number are divided by that of the reference. When measuring the response of a segment, for example, cavity field → e2, the response of the down-stream point is divided by the response of that of the upstream point, whether normalized by ddsI or not. This way, as with analog network measurements, response functions of segments can be measured using a single remote injection point.
Example closed-loop response functions measured in logic are shown in the following two graphs. They are referenced to ddsI. The small intensity at e4p reflects the low value of the proportional gain (0.05), while the integral gain is full scale. The phases roughly differ by multiples of 90 degrees at low frequencies due in part to the number of register delays, each of which shifts the response function by 90 degrees.

Measurements of most segments can be done open loop, the exceptions being e4p and integrate_out → din1_2. A further exception is the integrator, which must be stabilized by the loop at low gain. More about closed-loop measurements later.
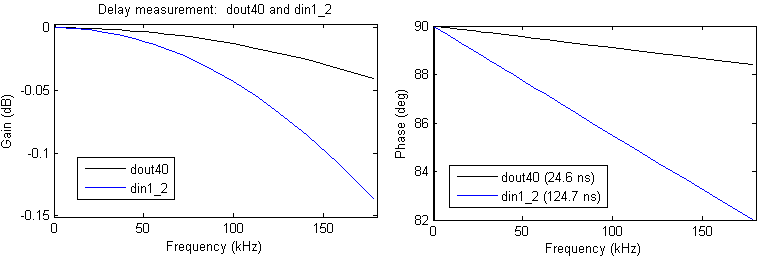
The next plot shows the response from ddsI to dout40 and din1_2 with the loop open, showing clearly their delays (1 and 5 clocks, respectively).

The phase graph precisely measures the delays to the two points. The table shows other open-loop measurements (except for through the integrator) of segments:
| start | end | delay (ns) | gain | |
|---|---|---|---|---|
| cav | → | e2 | 25.4 | 1/2 |
| e2 | → | e4p (via e2) | 50.6 | 8 kp |
| e2 | → | e4p (via e3) | 75.1 | 8 kp |
| e2 | → | integrate_out (via e2) | 120.2 | 1.59 MHz × kp ki/f |
| ddsI | → | dout40 | 24.6 | 1 |
| dout40 | → | din1_2 | 100.1 | 1 |
| din1_2 | → | cav | 490 | 0.62 |
As was mentioned earlier, the segments e4p and integrate_out → din1_2 must be constrained by the closed-loop response function. If G is the open-loop gain, the gain factor 1 − G is measured by dividing the open-loop ddsI → din1_2 response by the closed-loop ddsI → din1_2 response.

In these graphs, fb_loop.v's si parameter is 5. The magnitude of G for the upper-most trace for frequency f below 105 Hz is 176 kHz/f. The 176 kHz is the unity-gain frequency of the loop. Because the gain of the proportional branch is somewhat less than one, it does not affect the unity gain-frequency significantly. With the gain G measured we determine the unknown integrate_out → din1_2.
10-4.22/20 × 0.5 × kp × 0.5 ki/(2π f Ts) × unknown = 176 kHz/fwhere Ts is two clock periods. From this equation, the unknown gain is 0.99, or 1. With this last block known, the controller's gain model looks like this.

The rf system conceptually attaches to the din1_2 and cav ports on the right.
The loop gain as a function of kp with only the proportional-gain branch is shown in the next figure. Its slope is consistent with the figures in the block diagram and the table.

This model provides the information we need to set the controller's corner frequency to match the CESR cavity's bandwidth. Do this by equating the gains of the proportional and integral branches at the 8-kHz cavity bandwidth:
8 = 0.5 × ki/(2π 8 kHz Ts)and solve for ki, giving us ki = 0.04. The value of ki can be tuned, but this value is a good starting point, and probably near optimal at low beam currents.
What is evident from this analysis is that the loop through the proportional branch is barely above 1 when kp = 1. This is ok when there is no rf cavity and in fact causes instability when near one. But with an rf cavity, particularly with a relatively low damping rate as is the case with SC cavities, higher proportional gain at frequencies above the cavity bandwidth may be beneficial, particularly at low beam current. The gain range can be increased by changing a setting of the instance of fb_loop
The next plot illustrates noise suppression of the loop at varying loop gains (1/(1-G)).

The effect of varying the loop phase on the din1_2 phase response is readily seen in the next plot, and should serve as a useful diagnostic.

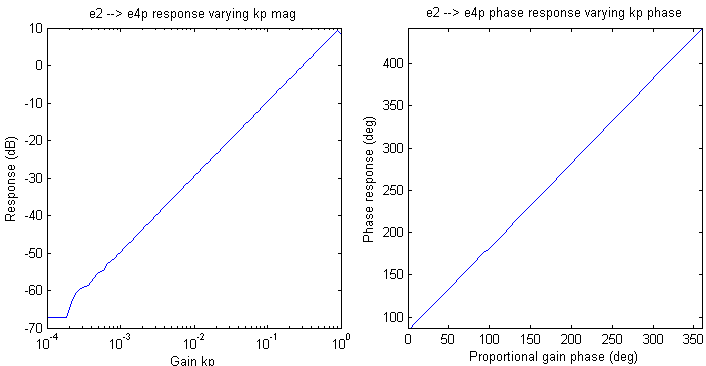
The next pair of graphs is a measurement of the response of the proportional gain block with varying kp and loop phase.

These measurements in most cases can be scripted, including managing front-panel settings. A few of the plots were generated that way.