From the late 19th century through the 1990s, the Sanborn Map Company authored what are arguably the most information-rich maps of urban America. The original intent of the maps was to provide a risk assessment tool to the fire insurance industry. They have come to be an important resource in all kinds of research settings, including urban geography, architectural history and preservation, urban planning, ethnic studies, urban archaeology, genealogy, and many others.
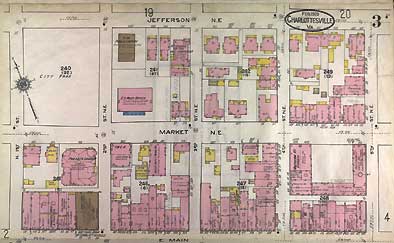
Figure 1: Example Sanborn Map (1920_03a) Because of their intended purpose, the most detailed aspect of the maps are the buildings. Looking at a Sanborn map, one can find information on construction materials, number of stories, entry-ways, ownership, street address, general (residential, commercial, public) as well as specific building type (office, warehouse, garage), and sometimes the date of construction. Other kinds of information that can be gleaned from the maps include street names and widths, land elevations, utility lines, parks and railroad tracks.
GEOG 5223 Final Project (Lessons 7, 8, 9 & 10) | |
Reconstructing 1920 Charlottesville, Virginia | |
by the "SketchTools" - December 2003 | |
|
Sections: Figures and Tables: |
The Final Class Project brings together most of the concepts and software
techniques learned during previous projects while simulating a realistic
proposal / pilot project effort. A group effort was encouraged
so we assembled a volunteer team dubbed the "SketchTools" by the instructor.
All four of us dig dirt professionally but from a different perspective.
The four SketchTools include; an archeologist, a geologist, a
geoenvironmental (civil) engineer, and a soil scientist. Unlike previous class projects, semi-complete "cook book" instructions were not provided. Instead, only goals and hints were provided to encourage a student lead project specific GIS design and implementation. Questions were encouraged and the class message board was well utilized. Weekly submittals were required to make sure that each group remains "on target". The final project is based on historical maps of Charlottesville, Virginia copyrighted by the Sanborn Map Company in 1920. According to the lesson background section: The final project premise states that the Albemarle County Historical Society (ACHS) located in Charlottesville Virginia intends to create GIS data layers from 20th century Sanborn maps to aid in land use change studies, genealogy, and visualization of their city. A proposal has been requested for a GIS that includes layers depicting 10-year intervals from 1900 through 1990. This final class project has our group of four "GIS practitioners" competing for the large contract by designing and implementing a pilot GIS project based on just two Sanborn maps (supplied in four scanned images: 120_02a.jpg &120_02b.jpg, plus 120_03a.jpg & 120_03a.jpg.) Thirty scanned map images were supplied so no two students were assigned the same image. Note: According to the map index, the city population was 15,000 in 1920. According to the US Census, the population had grown to 45,049 in 2000. |
|
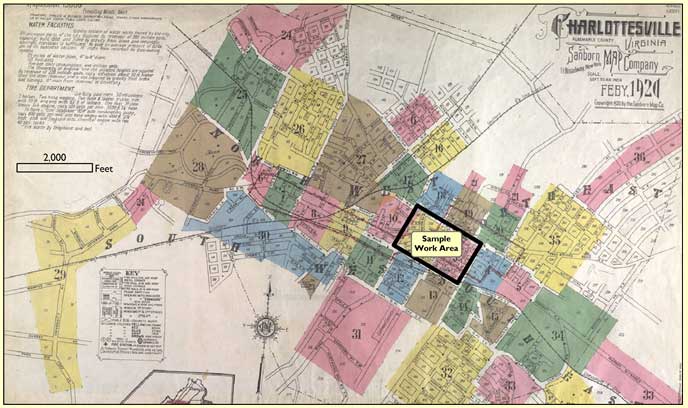
The SketchTools were assigned a pilot project sample work area in the heart of downtown Charlottesville. The digitized area is outlined below on a portion of a Sanborn Index Map. |
|
|
|
|
Figure 2: |
Charlottesville, Virginia 1920 Sanborn Index Map Showing the SketchTool's Sample Work Area |
|
Five Feature Classes and two Coded Domains were created for the relational database structure used to hold the pilot project's data. Both line and polygon class features were defined as follows:
All of these features are spatially dependent on each other. Similar to the relational database concepts of primary and foreign keys, the feature classes can be linked through their geometry via spatial joins. ArcCatalog was utilized to create the GIS "feature classes" (layers) and define their data structure. The standard feature class fields are not listed below. (For example, each attribute table includes an ObjectID field that is maintained by ArcView 8.3 as its primary key.) For project specific data storage needs, the following fields were added to the standard Attribute tables stored in an ArcView 8.3 Personal Geodatabase. Two coded domains are also utilized as described below. A limitation in the test pilot project personal database was found concerning the BUILDINGS Attribute Table. The Buildings table Height field defined as a short integer should have been defined as a floating point number instead. Some buildings have their height indicated as 1.5 or 2.5 stories on the Sanborn Map which can not be stored in an integer field. The heights were rounded-up to the nearest integer value. Note: A few heights are indicated with feet instead of stories on the Sanborn Map. These heights were converted to stories based on 10 feet equals = 1 story. (Probably on the low side.) |
| DOMAINS |
| ||||||||||||||||||||||||||||||||||||||||||||||||||||||||||||||||||||||||||||||||||||||||||||
| BUILDINGS |
| ||||||||||||||||||||||||||||||||||||||||||||||||||||||||||||||||||||||||||||||||||||||||||||
| BLOCKS |
|
||||||||||||||||||||||||||||||||||||||||||||||||||||||||||||||||||||||||||||||||||||||||||||
| RAILS |
|
||||||||||||||||||||||||||||||||||||||||||||||||||||||||||||||||||||||||||||||||||||||||||||
| STREETS |
|
||||||||||||||||||||||||||||||||||||||||||||||||||||||||||||||||||||||||||||||||||||||||||||
| MAPS |
|
||||||||||||||||||||||||||||||||||||||||||||||||||||||||||||||||||||||||||||||||||||||||||||
| Tables: |
Feature Class Attribute Table User Defined Fields added to store project specific needs. (The year / map_year is an alias / field name combination specified because field names can not be named "year".) | ||||||||||||||||||||||||||||||||||||||||||||||||||||||||||||||||||||||||||||||||||||||||||||
|
A proposed work flow was submitted on the 2nd week of the Final Project. The workflow listed many of the individual steps in a tutorial fashion. Only the major steps are outlined here. Additional detail is included in the next section (QA/QC).
|
|
|
Error-Checking and Error Correction Quality assurance/quality control procedures (QA/QC) for the proposed project will follow a plan of data entry, visual inspection, and standard queries to test for errors of entry and database structure. Data entry tasks include heads up digitizing of lines and polygons and keypunch entry of attributes for the same lines and polygons. The primary data source for the pilot project is 30 Sanborn map images from 1920. Data captured consists of street centerlines with address ranges, building footprints with addresses, heights, and use category, rail lines, Sanborn map extents, and municipal block footprints. Individual and groups of maps will be digitized by more than one technician and fitted together in a final mosaic for each decade. Attributes will be added by each technician at the time of digitization. Our pre-bid feasibility study used four technicians who each digitized one map. Only the street centerline and building footprint tasks were implemented. QA/QC began at the digitization stage by careful attention to detail by each technician. Independent error checking began at the merge stage as the individual contributions were assembled into a working prototype GIS. The following procedures where employed for each task:
|
|
|
|
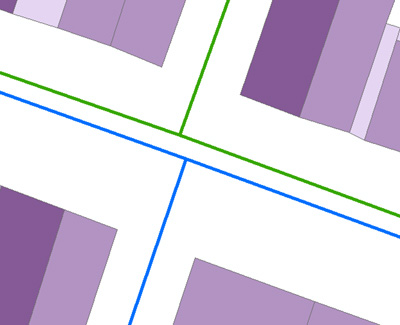
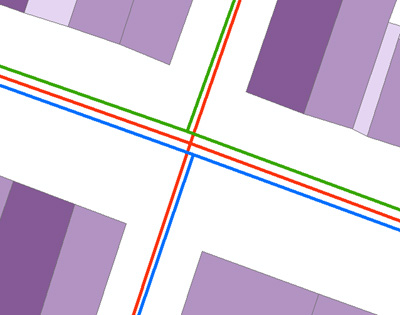
| Figure 3: |
Two screen shots showing: 1.) Mismatched individual street centerlines from adjacent maps, and 2.) Final compromise junction shown in red. |
|
|
|
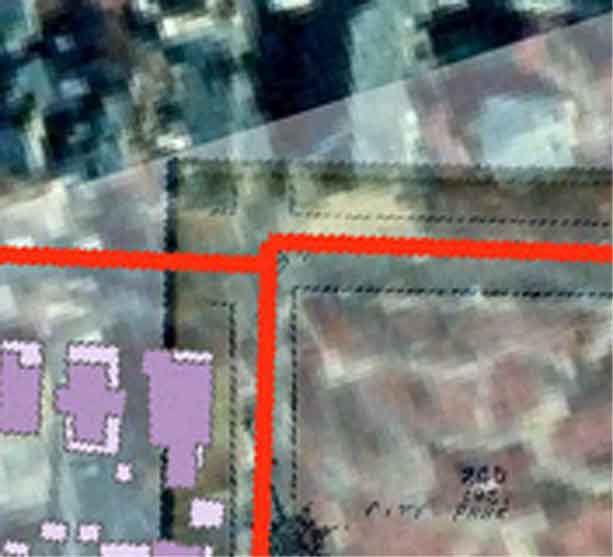
One source of error is the Sanborn Maps. We can not go back to 1920 and measure the city but we can spot inconsistencies. When the first two maps were merged together (1920_02a & 1920_2B) the alignment was disappointing. A better match was expected along 1st Street because both maps share relatively well defined landmarks for georeferencing. The intersection of Jefferson St. and 1st St. was studied closely. Both SketchTools georeferenced their map image using the same North-West corner of the city park (the South-East corner of the intersection). Differences in the georeferencing can be seen in the two screen shots below (with semi-transparent Sanborn maps shown over the modern orthorectified photo). However, the two Sanborn maps disagree with regard to east-west street alignment and widths. Map 1920_02a shows straight center-line alignment through the intersection whereas Map 1920_03a shows a noticeable offset with Jefferson St. N.W. significantly wider. |
|
|
|
|
|
Figure 4: |
Two screen shots showing the intersection of Jefferson St. and 1st St. - Map 1920_02A versus map 1920_03A |
|
|
|
|
|
|
|
Figure 5: |
Georeferencing Error Illustrated by Comparison. - Two SketchTools georeferenced Map Image 1920_02a. Difference in the georeferencing are illustrated by offset building locations in a few select cases. The large building was the McGuffey Primary School in 1920 (now used as an "Arts Center"). The South-East corner is offset by 5.3 meters. |


|
The Metadata (data about the data) associated with this pilot project was entered in ArcCatalog and exported as HTML. This metadata is available for viewing via the following links. |
|||||||||||||||||||||||||||||||||||||||
|
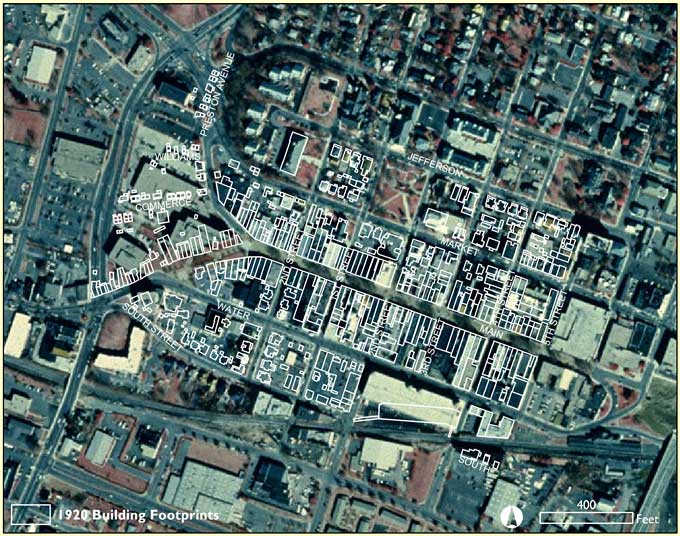
Thematic Map & Possible Applications The assigned Sanborn maps included current usage for the vast majority of the buildings. In the few cases where information was not included, usage was judged based on nearby buildings. The SketchTool's assigned sample work area literally includes the center of town as defined by the intersection of 1st Street and Main Street. The following thematic maps shows that this is a commercial area as one would expect. |
|||||||||||||||||||||||||||||||||||||||
 |
|||||||||||||||||||||||||||||||||||||||
| Figure 6: |
Thematic Map of Charlottesville, Virginia - Building usage classified as shown. |
||||||||||||||||||||||||||||||||||||||
|
|
|||||||||||||||||||||||||||||||||||||||
|
|
|||||||||||||||||||||||||||||||||||||||
|
Figure 7: |
Comparison of Historic and Modern Development in downtown Charlottesville Virginia - An Example of Future Spatial Database Applications possible with this GIS. |
||||||||||||||||||||||||||||||||||||||
|
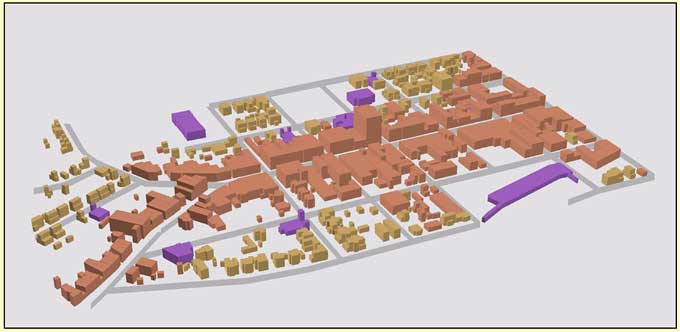
One of the SketchTools has access to the optional ArcGIS 3D Analyst extension. This optional ArcView 8.x extension was used to generated the following 3-D rendering based on the Building Height attribute field. This software was also utilized to generated a "fly-over" 3-D Movie (in "avi" format) from the SketchTool pilot project data set.. Note: the G5223_FP_3D-Movie.avi file has been tested with Windows Media Player version 9. The 4.13 MB avi file will take a significant amount of time to download even over a fast internet connection. |
|||||||||||||||||||||||||||||||||||||||
|
|
|||||||||||||||||||||||||||||||||||||||
|
Figure 8: |
3D Visualization of Charlottesville, Virginia (looking ~ east) Note: a 3-D Movie is available for download by clicking here. |
||||||||||||||||||||||||||||||||||||||
|
The digitizing process was progressing relatively rapidly as the end of this
tedious project task approached. Based on the pilot project and some
anticipating additional speed improvement, the following estimate was made
for the time needed to digitize all of the maps for all ten decades. |
|||||||||||||||||||||||||||||||||||||||
|
Note: The digitization estimate assumes that each decade includes a similar set of 30 map images. Some additional time should be added to include digitizing the Rail Road layer. |
||||||||||||||||||||||||||||||||||||||
|
|
|
||||||||||||||||||||||||||||||||||||||
|
Sources | |||||||||||||||||||||||||||||||||||||||
|
|||||||||||||||||||||||||||||||||||||||
| Go To the Top of Page | |||||||||||||||||||||||||||||||||||||||